Field notes: the berth where three makers' cranes stood side by side
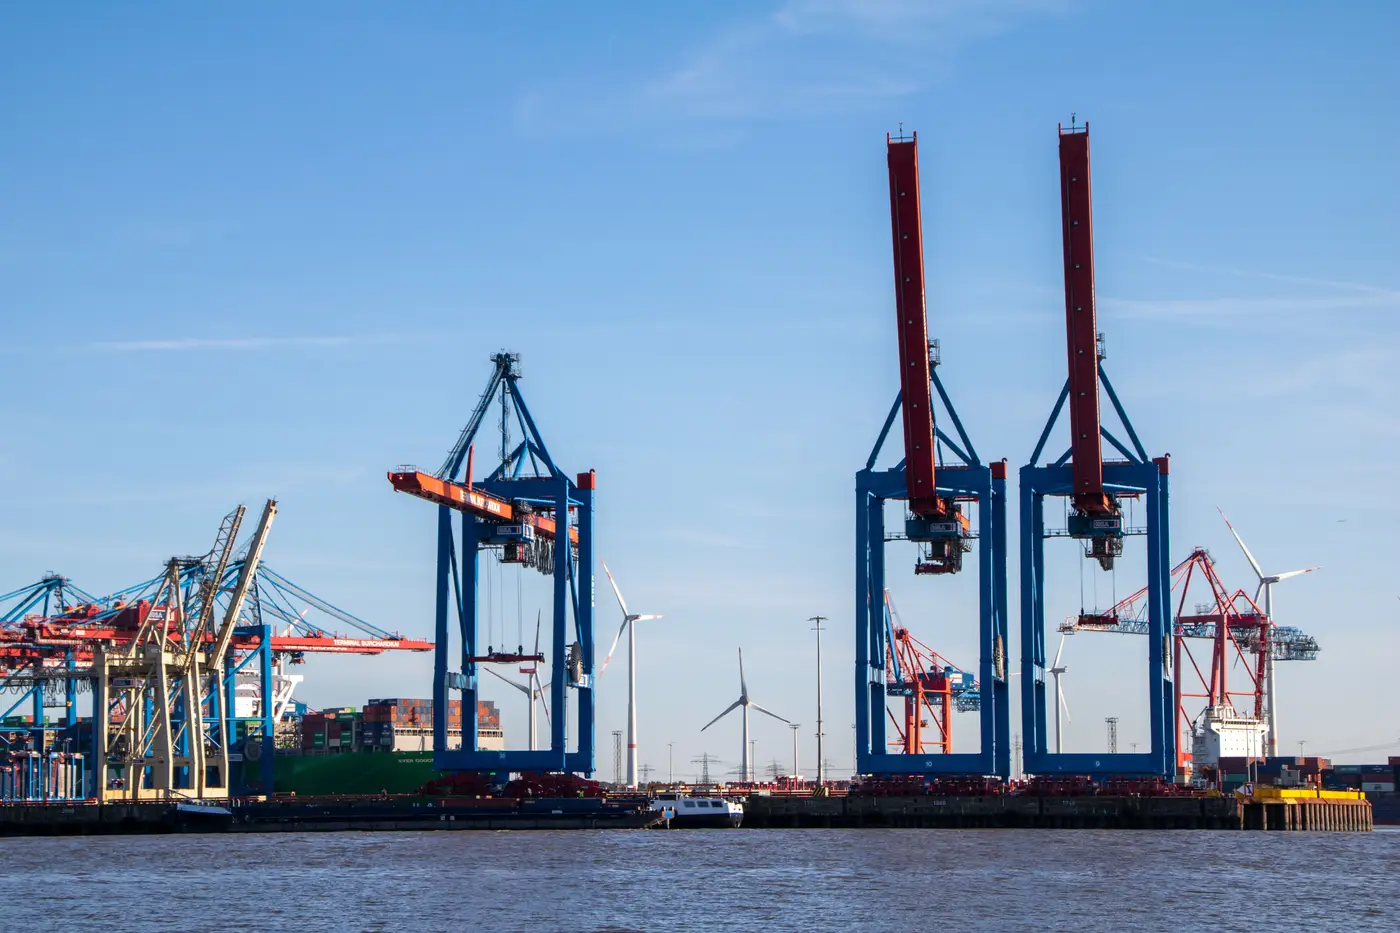
Every so often you walk a quay and the skyline above the apron stops making sense as a single order. One STS has the boxy portal frame and the house livery you'd expect from a ZPMC build. Two bays down, the boom profile kinks differently, the machinery house sits lower, and the paint says Liebherr before the nameplate ever confirms it. A third, older unit at the far end of the berth has the stubbier backreach and the squared-off A-frame of something that's been there since the terminal's first expansion, long before either of the other two showed up.
This berth didn't end up looking like this by design. It happened in layers. A terminal operator orders a batch of cranes for a new berth extension from whoever won that tender cycle. Five, ten, fifteen years later the box volumes outgrow the original fleet and a second order goes out, sometimes to the same maker, sometimes not, because the tender process doesn't care about matching liveries, it cares about lift height, outreach, and delivery schedule. Add a refurbished unit bought secondhand from another port going through a downsizing, and you get a gantry rail with three generations and three manufacturers standing in a row, each one a fossil record of a different procurement cycle.
For anyone tracking OEM footprint at the terminal level, this is the detail that a national or regional "installed base" number flattens out of existence. A market share figure tells you a maker has, say, a strong position in a country's container terminals. It doesn't tell you that the position is concentrated in three berths at one hub and absent everywhere else, or that a competitor's older cranes are still running on the next rail over and due for replacement inside a normal fleet-renewal cycle. The berth-by-berth picture is where the actual competitive story lives, and it's also the picture that's hardest to get without walking every quay yourself.
That's the part that makes mixed-OEM berths worth noting rather than just mildly interesting to look at. Each crane in that row is a separate attribution problem. Boom geometry, portal shape, machinery house proportions, and livery all carry maker signatures that someone who's spent time around this equipment can read at a distance, the same way you'd recognize a boom profile before you could read the hull paint on the ship it's loading. A height and reach estimate off the same imagery adds the dimension that tells you whether that older unit at the end of the rail is still a Panamax-class workhorse or has already been outclassed by the neighbors it's standing next to, which is usually the tell for how close it is to replacement.
Multiply that one berth by every terminal in a market and the fossil-record problem becomes the actual job: a full inventory that doesn't just say which maker has share, but which maker has share where, on which class of crane, and next to how much aging equipment that's a near-term replacement opportunity or a competitive threat depending on which side of the order you sit on. Building that picture terminal by terminal, without flying someone to every quay fence in the region, is the whole reason Crane Fleet Mapping exists as a terminal-by-terminal crane inventory rather than a country-level market share chart.
Next time you're the one standing at the fence line counting booms, it's worth asking whether that berth is the exception or whether your whole target market looks like it under the right imagery. Crane Fleet Mapping is built to answer that without the fence line.